Active
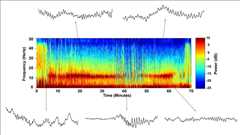
View Entry | Brain waves of a patient anesthetized with propofol6779| A representation of a patient’s brain waves after receiving the anesthetic propofol. All anesthetics create brain wave changes that vary depending on the patient’s age and the type and dose of anesthetic used. These changes are visible in raw electroencephalogram (EEG) readings, but they’re easier to interpret using a spectrogram where the signals are broken down by time (x-axis), frequency (y-axis), and power (color scale). This spectrogram shows the changes in brain waves before, during, and after propofol-induced anesthesia. The patient is unconscious from minute 5, upon propofol administration, through minute 69 (change in power and frequency). But, between minutes 35 and 48, the patient fell into a profound state of unconsciousness (disappearance of dark red oscillations between 8 to 12 Hz), which required the anesthesiologist to adjust the rate of propofol administration. The propofol was stopped at minute 62 and the patient woke up around minute 69. | | Public Note | | | | | Internal Note | | Technical description from Dr. Brown: Each anesthetic drug creates strong systematic oscillations in the patient’s brain waves following administration. The oscillations are easily visible in the electroencephalogram (EEG) and change systematically with anesthetic class, anesthetic dose, and patient age. Although the oscillations are clearly visible in raw EEGs, they are much easier to see and interpret using the spectrogram. The spectrogram is a decomposition of the EEG signal by time (x-axis), frequency (y-axis), and amplitude or power (color scale). The power is expressed on a logarithmic scale in decibels. High amplitude or high power is red, whereas low amplitude or low power is blue. The spectrogram is shown here for the anesthetic propofol, which is the most widely used anesthetic around the world. The two large red bands show that propofol produces oscillations between 8 to 12 Hz (cycles/sec), termed alpha oscillations; and other oscillations between 0.1 and 4 Hz, termed slow-delta oscillations. The 5 time-domain traces show the raw EEG signals at the indicated times. Anesthesia is started at approximately minute 5 by administering a bolus of propofol. At this point, the alpha and slow delta oscillations rapidly appear, and the patient immediately becomes unconscious. From then until minute 69, unconsciousness is maintained by administering a continuous intravenous infusion of propofol. During the time from minute 5 to minute 35, the patient’s alpha and slow delta bands are readily visible, and the patient is unconscious. The alpha band appears to break up between minute 35 and minute 48. Here, the patient is in burst suppression, a profound state of unconsciousness. The anesthesiologist brings the patient out of burst suppression by turning down the rate of the propofol infusion. The alpha oscillations reappear strongly at minute 48 as the burst-suppression period ends. Shortly after the infusion is turned off, at about minute 62, the alpha oscillations disappear, and the patient wakes up around minute 69. | | | Keywords | | Anesthesia | | | Source | | Emery N. Brown, M.D., Ph.D., Massachusetts General Hospital/Harvard Medical School, Picower Institute for Learning and Memory, and Massachusetts Institute of Technology. | | | Date | | 2021-08-24 00:00:00 | | | Credit Line | | Ohyoon Kwon, Massachusetts General Hospital/Harvard Medical School; and Emery N. Brown, M.D., Ph.D., Massachusetts General Hospital/Harvard Medical School, Picower Institute for Learning and Memory, and Massachusetts Institute of Technology. | | | Investigator | | | | | Record Type | | Illustration | | | Topic Area(s) | | ;#Chemistry, Biochemistry, and Pharmacology;# | | | Previous Uses | | | | | Status | | Active | |
| | View All Properties | | Edit Properties |
|