Active
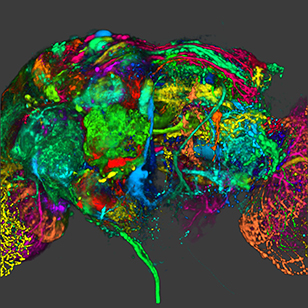
View Entry | Color coding of the Drosophila brain - image5838This image results from a research project to visualize which regions of the adult fruit fly (Drosophila) brain derive from each neural stem cell. First, researchers collected several thousand fruit fly larvae and fluorescently stained a random stem cell in the brain of each. The idea was to create a population of larvae in which each of the 100 or so neural stem cells was labeled at least once. When the larvae grew to adults, the researchers examined the flies’ brains using confocal microscopy. With this technique, the part of a fly’s brain that derived from a single, labeled stem cell “lights up. The scientists photographed each brain and digitally colorized its lit-up area. By combining thousands of such photos, they created a three-dimensional, color-coded map that shows which part of the Drosophila brain comes from each of its ~100 neural stem cells. In other words, each colored region shows which neurons are the progeny or “clones” of a single stem cell. This work established a hierarchical structure as well as nomenclature for the neurons in the Drosophila brain. Further research will relate functions to structures of the brain.
Related to image 5868 and video 5843 | | Public Note | | | | | Internal Note | | Acknowledgements:
Dr. Kei Ito’s group at the University of Tokyo prepared the biological samples and generated the Drosophila brain data set. FluoRender, developed at the SCI Institute, University of Utah, was used for the visualizations. A 96-channel volumetric Drosophila brain atlas was presented with all its fine details thanks to the collaborations among researchers in biology and computer technologies.
Reference:
Ito, M., Masuda, N., Shinomiya, K., Endo, K. & Ito, K. (2013). Systematic analysis of neural projections reveals clonal composition of the Drosophila brain. Current Biology, 23(8), 644-655.
From Yong Wan (wanyong@cs.utah.edu)
The software (FluoRender) was initially funded with the R01 GM98151-04 to Charles Hansen (PD Jim Deatherage). That grant ended but now the software is funded through the BTRR to Chris Johnson.
Additional Reference:
Wan, Y., Otsuna, H., Holman, H. A., Bagley, B., Ito, M., Lewis, A. K., Colasanto, M., Kardon, G., Ito, K. & Hansen, C. FluoRender: joint free-hand segmentation and visualization for many-channel fluorescence data analysis. Manuscript submitted to BMC Bioinformatics
| | | Keywords | | Drosophila
Fruit fly
BTRR
Brain | | | Source | | Yong Wan from Charles Hansen’s lab, University of Utah. Data preparation and visualization by Masayoshi Ito in the lab of Kei Ito, University of Tokyo. | | | Date | | | | | Credit Line | | Yong Wan, Charles Hansen and Chris R. Johnson, University of Utah | | | Investigator | | Chris R. Johnson and Charles (“Chuck”) Hansen, University of Utah | | | Record Type | | Photograph | | | Topic Area(s) | | ;#Cells;#Tools and Techniques;# | | | Previous Uses | | Strathmore Mansion 2017 | | | Status | | Active | |
| | View All Properties | | Edit Properties |
|